Home

The Pipeline

1.Pipeline Overview

DeepPVMapper is a deep learning pipeline, inspired by 3D-PV-Locator (Mayer et al., 2022), that detects rooftop photovoltaic systems from aerial imagery and characterizes them. It proceeds in two stages: polygon extraction, and characteristics extraction.
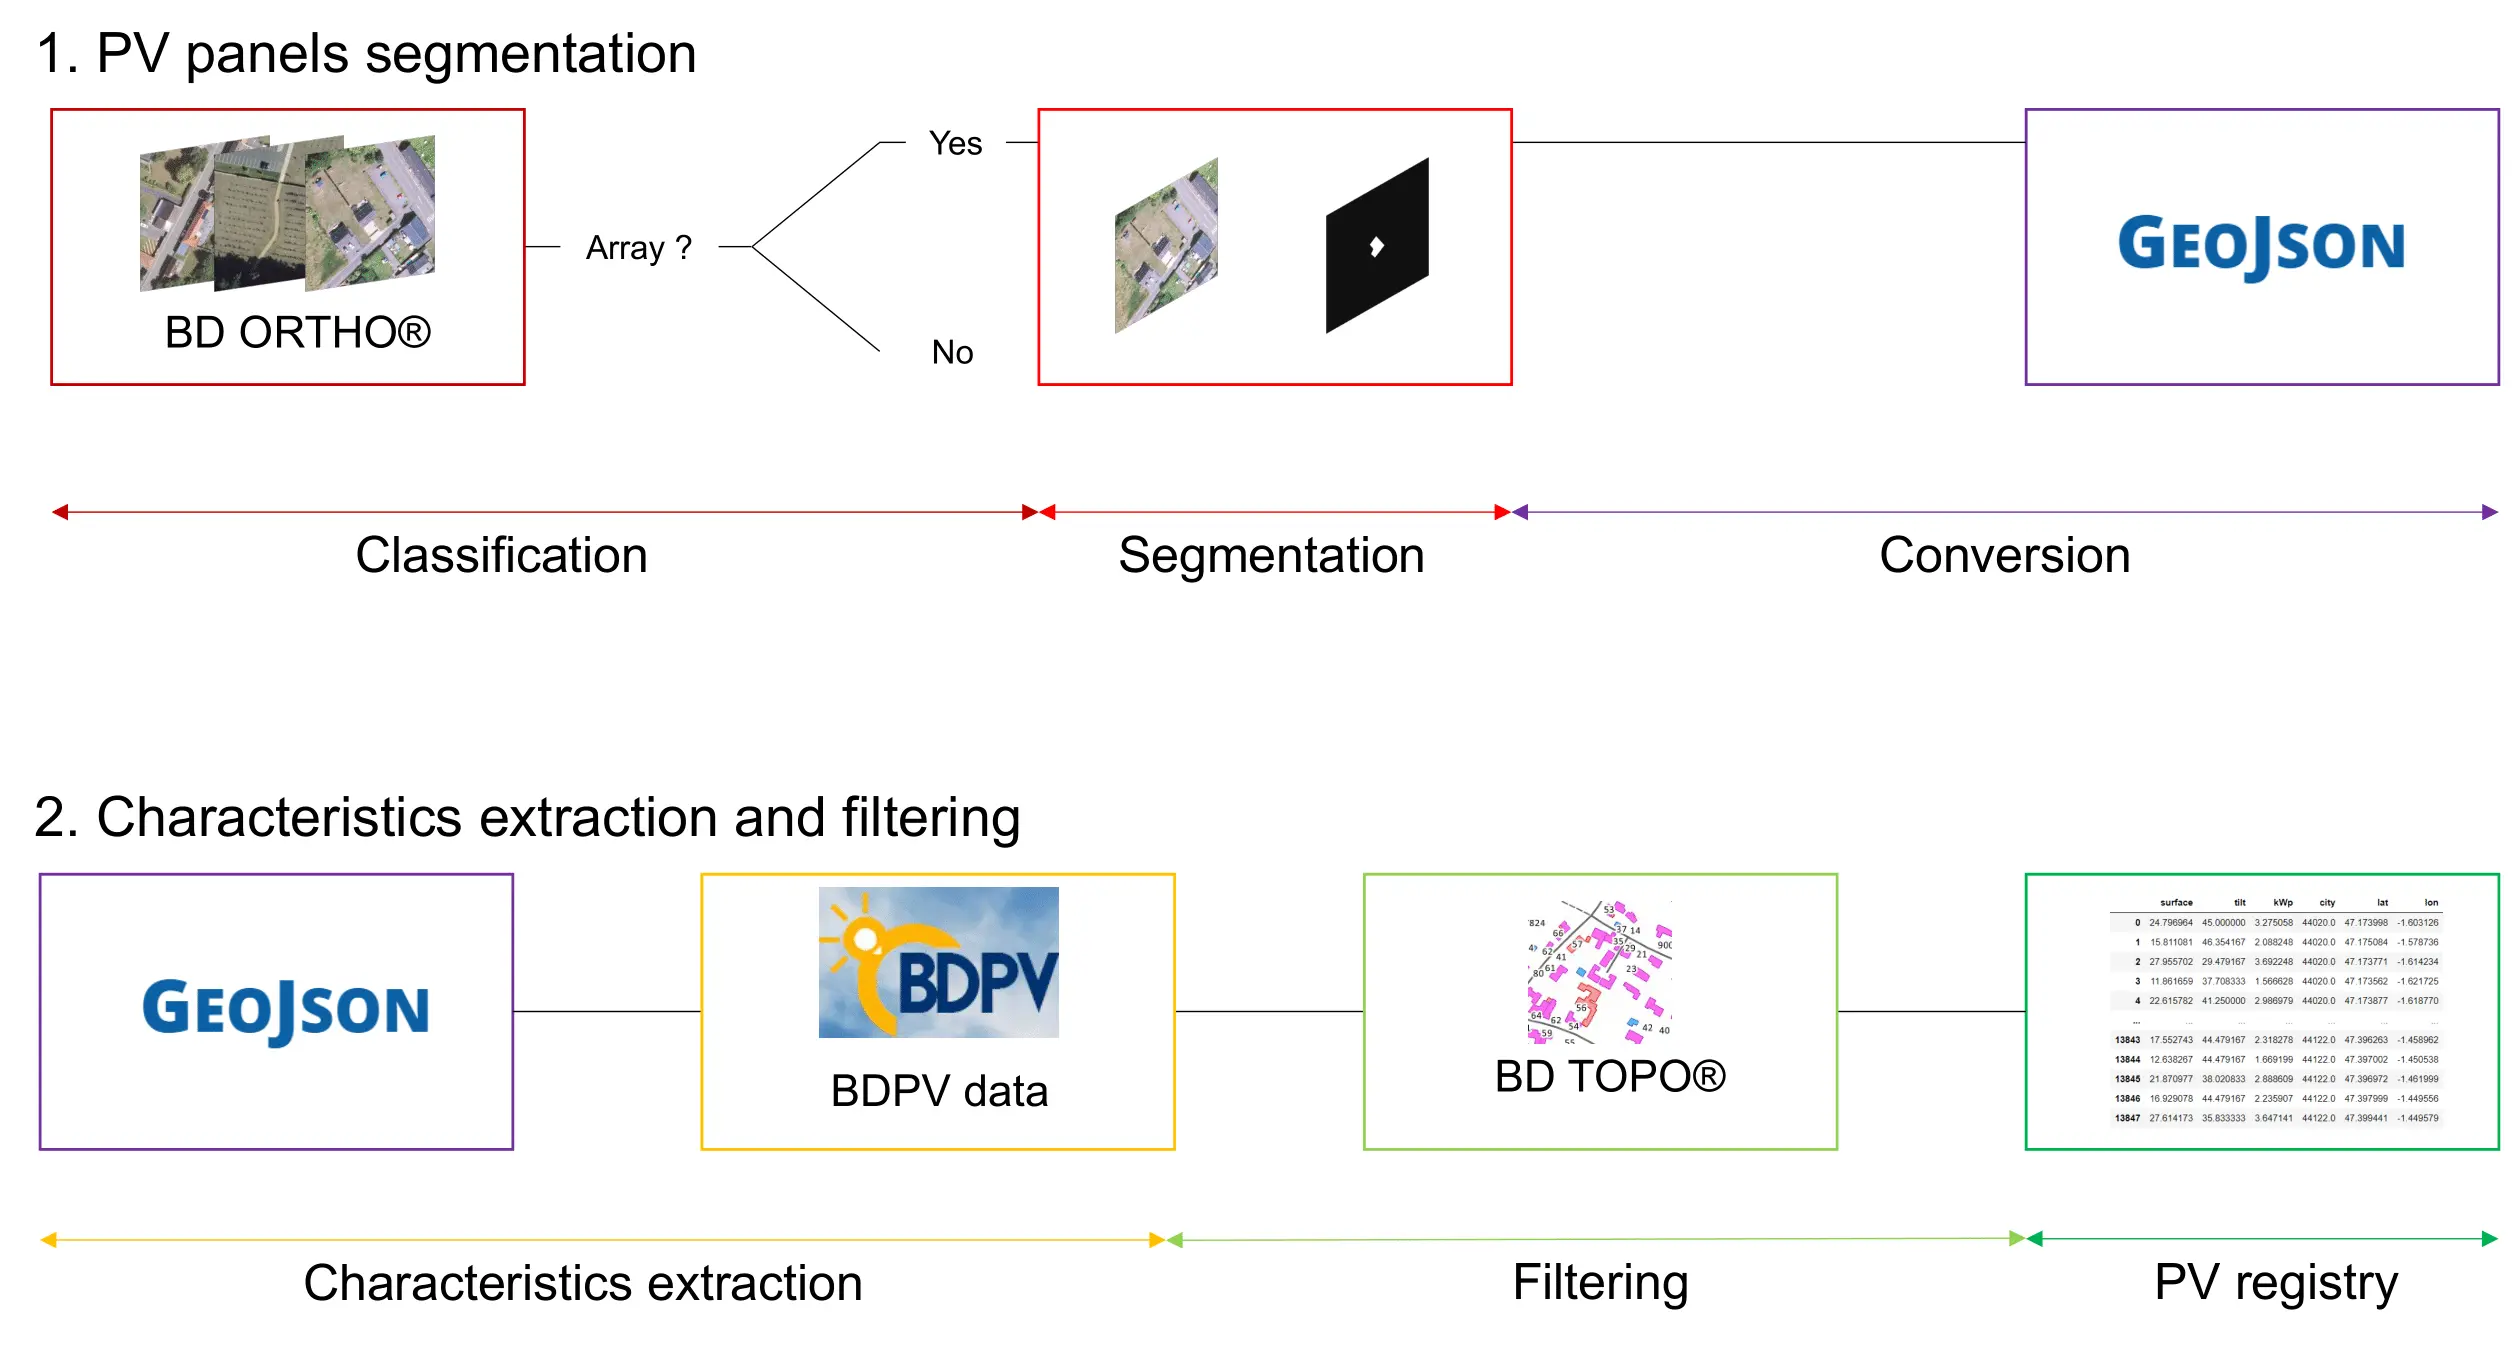
DeepPVMapper pipeline flowchart
Overview of the DeepPVMapper pipeline, from aerial tiles to a characterized PV registry

1.1Polygon Extraction

Aerial tiles are first divided into patches and passed through a classification model (Inception v3) that flags patches likely to contain a PV installation. Positively classified patches are then passed to a segmentation model (DeepLab v3), which extracts precise polygon boundaries for each detected system. This two-step classify-then-segment design keeps the pipeline computationally tractable at national scale, since the costly segmentation step only runs on the small fraction of patches the classifier flags as positive.

1.2Characteristics Extraction

The extracted polygons are processed with pypvroof, a package developed for this project and published on PyPI, which estimates each system's surface area, tilt, orientation (azimuth), and installed capacity. Detections are then cross-referenced with BD TOPO®, IGN's national building database, in a cleanup & filtering step that (i) keeps only detections that sit on rooftops and (ii) merges multiple detections belonging to the same roof into a single system. The result is a clean, geolocated PV registry, with one entry per physical installation and its estimated characteristics.
2.Training

2.1Training Data

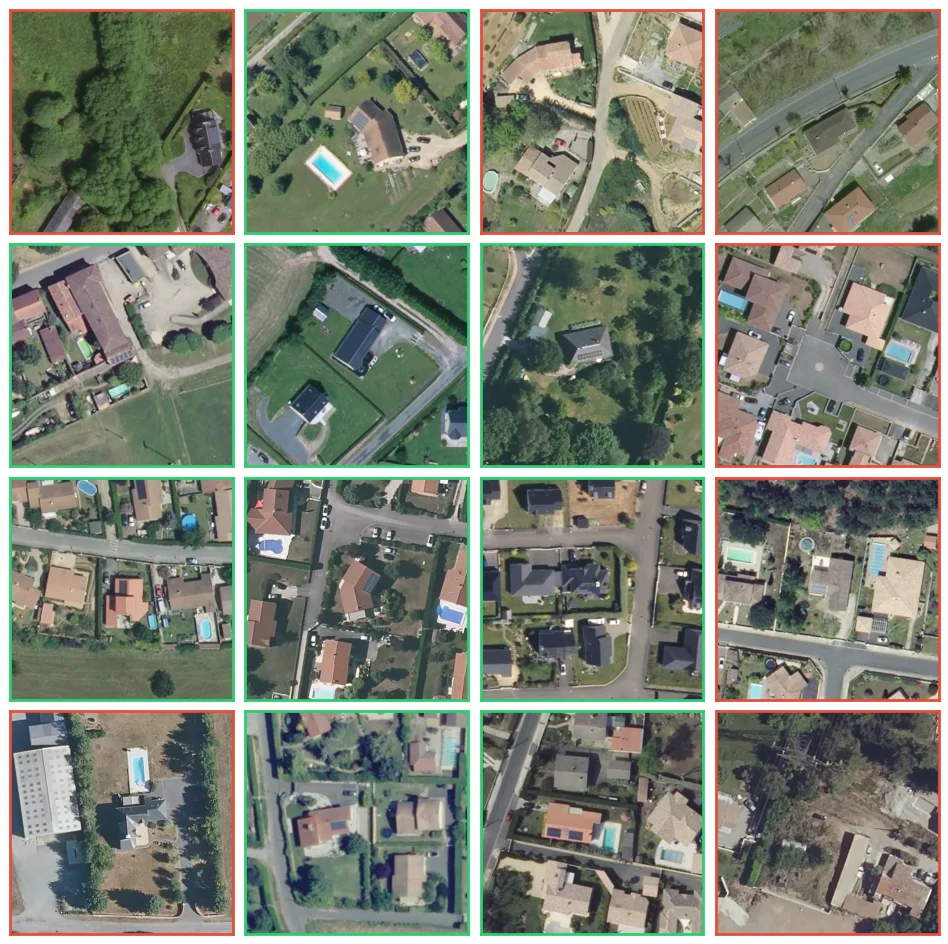
The models are trained on BDAPPV, a dataset of aerial images of rooftop PV installations in France and Belgium, with segmentation masks and installation metadata. Images are provided by two aerial imagery providers — Google and IGN — for a total of 45,733 images, making the dataset suitable for both segmentation/classification benchmarks and distribution shift evaluation across imagery sources. All images are 400×400 px PNGs, with binary PNG segmentation masks at the same resolution; the Google set is a superset of the IGN one, i.e. every IGN installation also has a corresponding Google image. For DeepPVMapper, since deployment runs on IGN's BD ORTHO® imagery, the models are trained specifically on the IGN subset (17,325 images, including 7,685 positive samples).

Provider Images Positives (masks) Negatives Note
Google 28,408 13,303 15,105 399 images excluded (no metadata entry)
IGN 17,325 7,685 9,640
BDAPPV dataset composition. Kasmi et al., Scientific Data, 2023.
Sample images and masks from the BDAPPV dataset
Sample images (IGN images) from the BDAPPV dataset.

2.2Training Results

The table below, reproduced from Kasmi et al. (2022), benchmarks the classification and segmentation accuracy of our models against comparable works from the literature. The ground sampling distance (GSD) indicates how detailed the imagery is — the lower the GSD, the more detailed the image. PV panels generally cannot be detected on images with a GSD greater than 30 cm/pixel.

Work Classification
F1-score
Segmentation
IoU
GSD (cm/pixel)
Mayer et al. 0.87 0.74 10
Malof et al. 0.67 30
Zech & Ranalli 0.82 10
Parhar et al. 0.97 0.86 10
Ours 0.84 0.86 20
Table 2 (Kasmi et al., 2022). Classification and segmentation accuracy — full references for each work are listed in the References section below.

3.Deployment

The pipeline is then deployed across France, department by department. Mapping a single department takes roughly 6 to 10 hours, depending on its size and the available hardware. The main bottleneck is the preprocessing of image tiles into thumbnails. Raw departmental detections are subsequently postprocessed and merged into a single file.

10 departments had been mapped by 2022, and 38 by April 2024. The first complete mapping of France was completed in 2024, using imagery acquired between 2018 and 2023. Several departments have since been mapped three to four times, creating a dynamic dataset that can be used to study deployment dynamics and peer effects.

The first release of the dataset, in July 2026, was run on the latest IGN imagery available at the time, spanning 2022 to 2025. As IGN updates its imagery on a rolling basis, the dataset is designed to be regularly updated. Overall, all but 4 departments had been covered at least twice by DeepPVMapper, enabling the computation of a first_seen attribute in OpenPVMapper by merging detections across multiple imagery vintages.

The data release on Zenodo includes the latest coverage file, obtained by merging the most recent mapping of each department. It also includes all raw departmental detections, covering both the latest and previous imagery vintages.

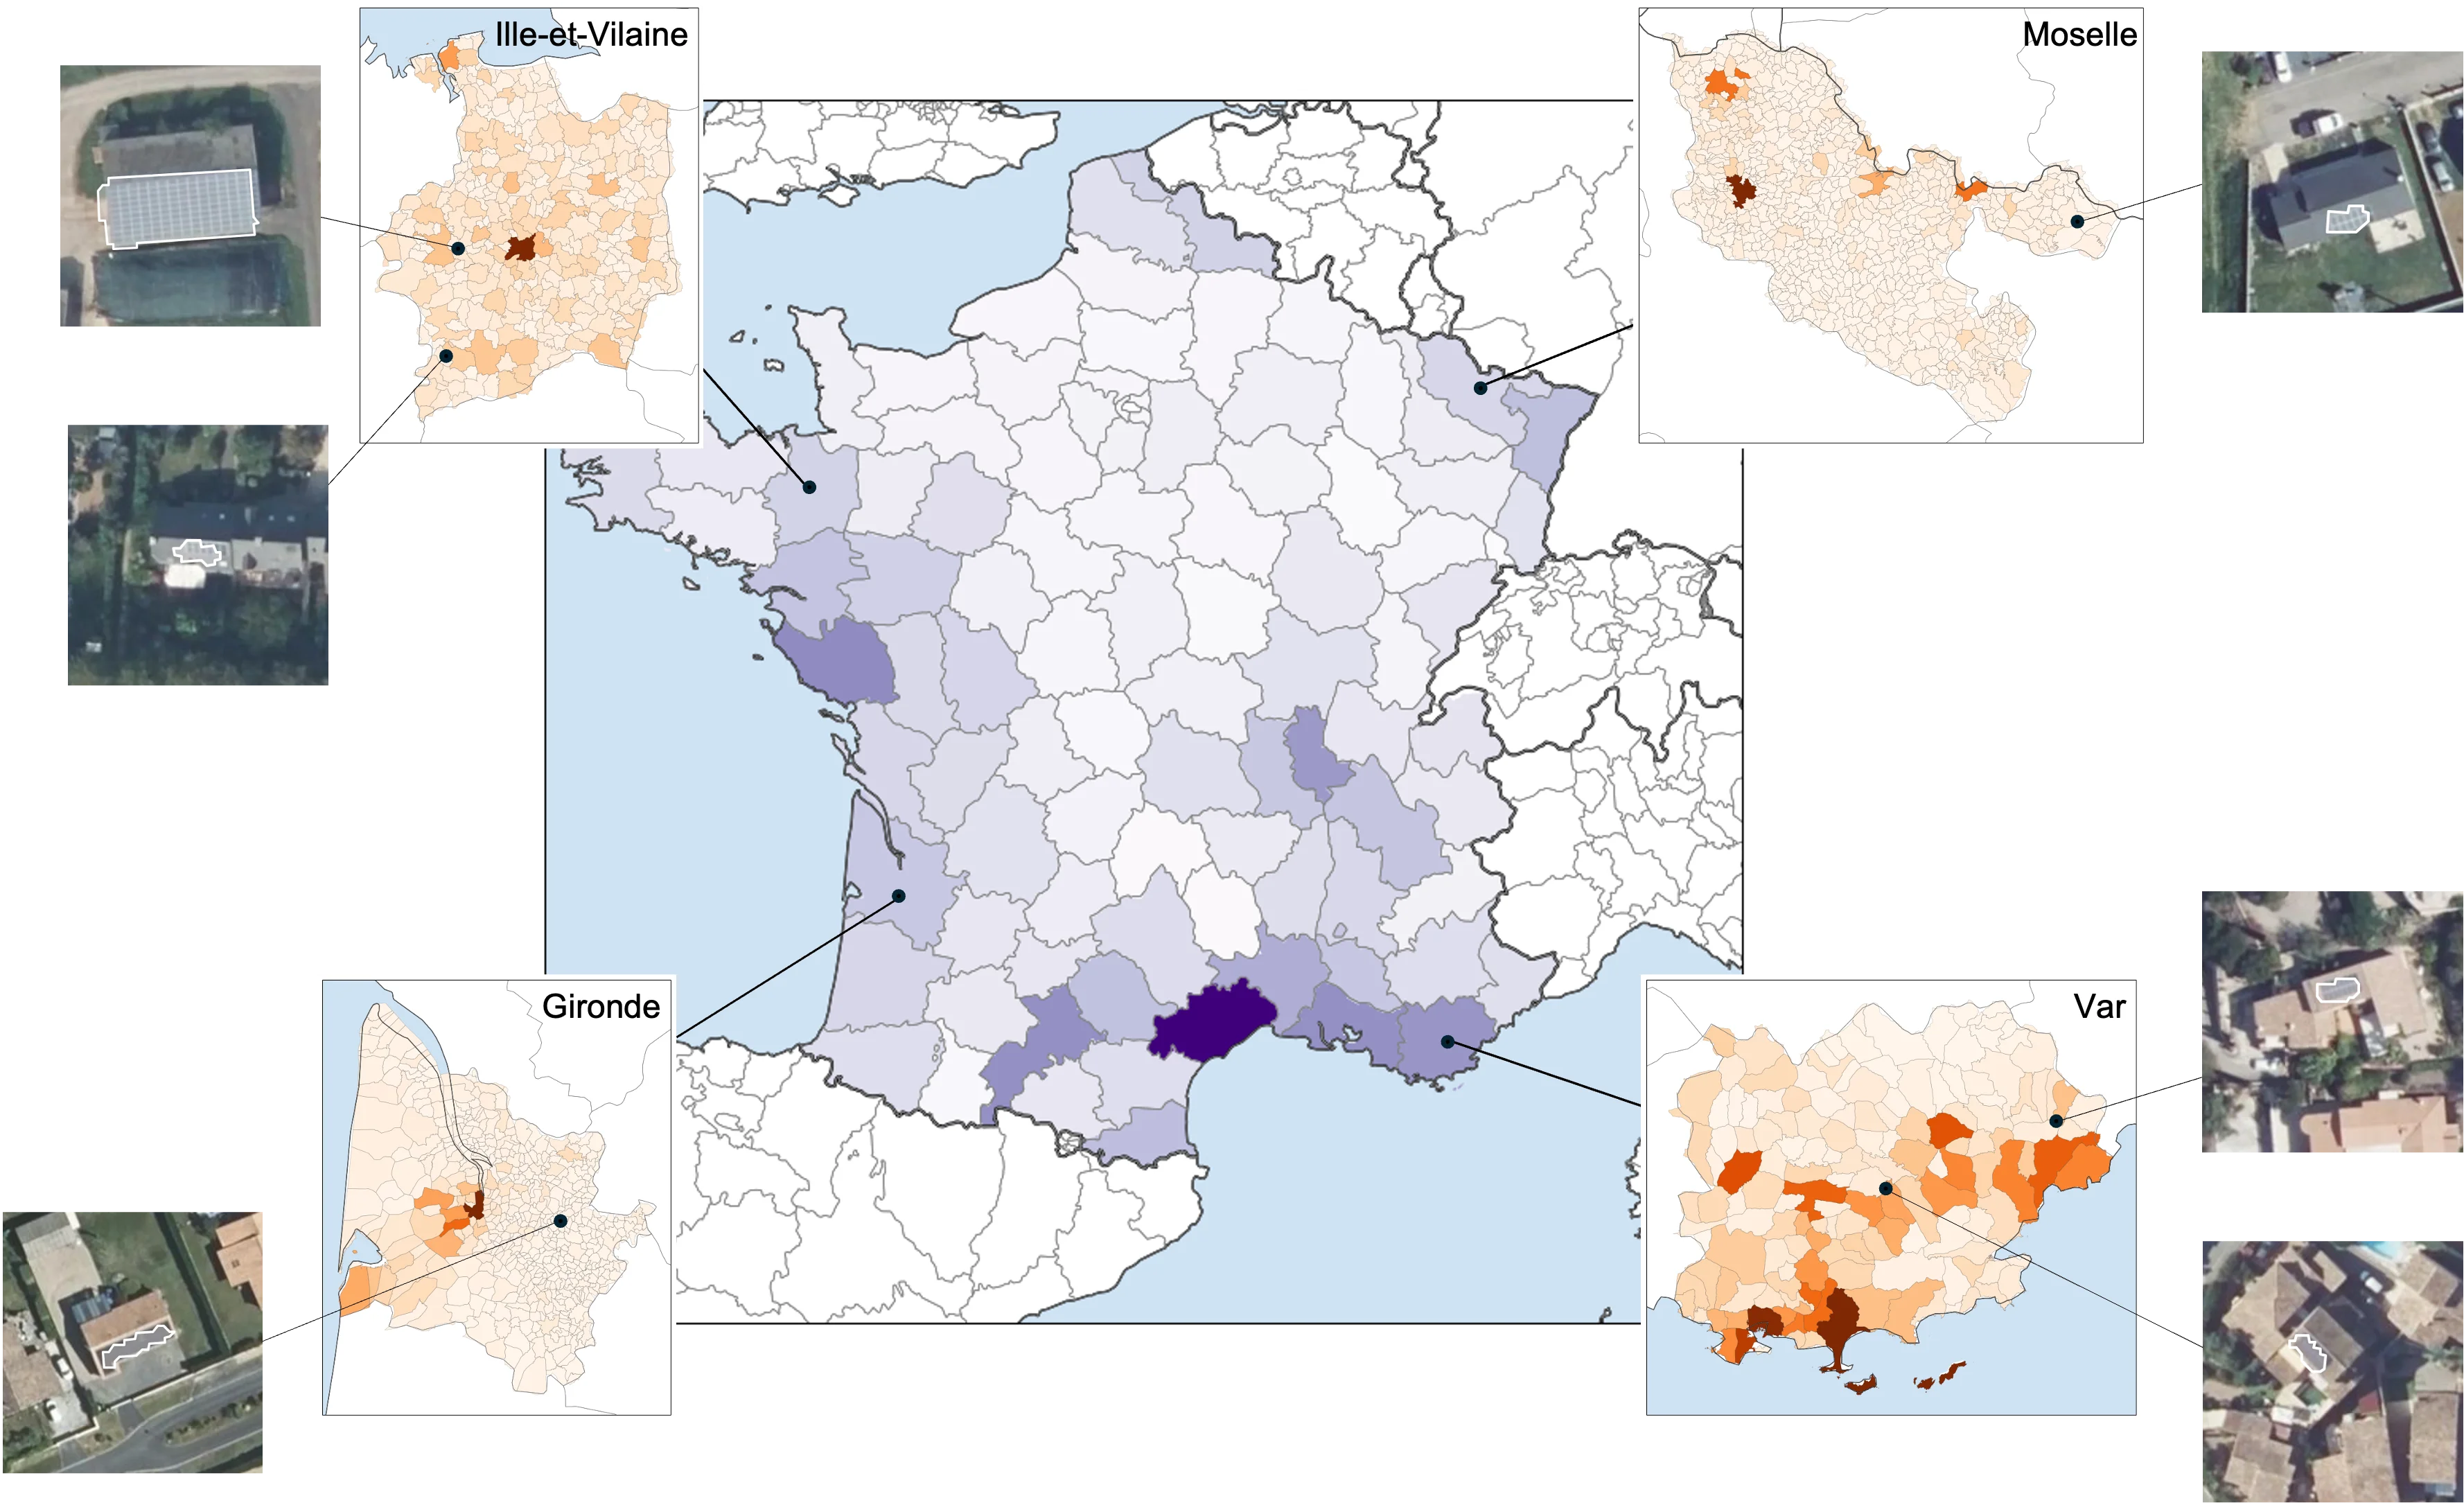
The current release of the dataset (July 2026), comprising detections from the latest IGN imagery only, contains 589,623 installations, totalling 2.9 GWp of installed capacity. The imagery spans from 2022 to 2025.

590k Detected PV systems
2.9 GWp Detected installed capacity
209 Départements-year mappings
DeepPVMapper mapping results
Overview of the mapping of rooftop PV systems by DeepPVMapper. The darker, the higher the installed capacity.

References

Mayer, J., Rausch, B., Arlt, M.-L., Gust, G., Wang, Z., Neumann, D., & Rajagopal, R. (2022). 3D-PV-Locator: Large-scale detection of rooftop-mounted photovoltaic systems in 3D. Applied Energy, 310, 118469.

Malof, J. M., Li, B., Huang, B., Bradbury, K., & Stretslov, A. (2019). Mapping solar array location, size, and capacity using deep learning and overhead imagery. arXiv preprint arXiv:1902.10895.

Zech, M., & Ranalli, J. (2020). Predicting PV areas in aerial images with deep learning. In 2020 47th IEEE Photovoltaic Specialists Conference (PVSC) (pp. 0767–0774). IEEE.

Parhar, P., Sawasaki, R., Todeschini, A., Reed, C., Vahabi, H., Nusaputra, N., & Vergara, F. (2021). HyperionSolarNet: Solar panel detection from aerial images. In NeurIPS 2021 Workshop on Tackling Climate Change with Machine Learning.

Kasmi, G., Saint-Drenan, Y. M., Trebosc, D., Jolivet, R., Leloux, J., Sarr, B., & Dubus, L. (2023). A crowdsourced dataset of aerial images with annotated solar photovoltaic arrays and installation metadata. Scientific Data, 10, 59.

Trémenbert, Y., Kasmi, G., Dubus, L., Saint-Drenan, Y. M., & Blanc, P. (2023). PyPVRoof: a Python package for extracting the characteristics of rooftop PV installations using remote sensing data. arXiv preprint arXiv:2309.07143.

Kasmi, G., Dubus, L., Blanc, P., & Saint-Drenan, Y. M. (2022). Towards unsupervised assessment with open-source data of the accuracy of deep learning-based distributed PV mapping. arXiv preprint arXiv:2207.07466.
